
Minimum Viable Liquidity
Prediction markets are the first asset class where more isn’t necessarily more


I joined Kalshi Trading, the exchange’s in-house market-making operation, in the summer of 2022. CPI was the hottest story in the world. Inflation had just hit 9.1%, and the CPI prediction markets on Kalshi were buzzing. Headline month-over-month contracts were pulling in 250,000 to 480,000 contracts per release cycle, enormous by the standards of a young exchange. Casual traders flooded in, people who followed the inflation news and wanted to express a view.
Then a handful of quantitative modelers built serious CPI forecasting pipelines. They pulled the component data, modeled the seasonal adjustments, tracked the BLS methodology1. And month after month, they ate. The casual traders got picked apart. They were paying tuition, and eventually they stopped enrolling. Around the same time, CPI fell out of the news cycle. The fish stopped losing money and left, and no new fish replaced them. These were the dog days, where hardly any volume traded.

By mid-2024, headline CPI events were drawing as few as 12,000 contracts, a shadow of the 2022 peaks. Yet the forecast accuracy held: a handful of sharp traders, maybe five or ten at most, running fully built models, were trading against each other for a few thousand dollars each month… and so the forecasts stayed tight.
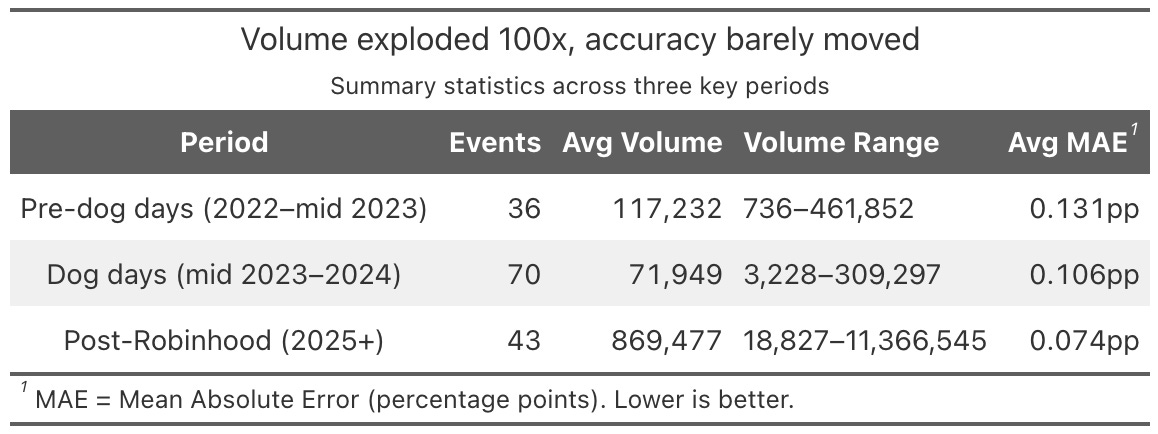
Then Robinhood integrated Kalshi contracts in early 2025, and the volume came roaring back. The April 2025 headline year-over-year event drew 11.4 million contracts—816 times more than the dog days trough. The accuracy barely moved.
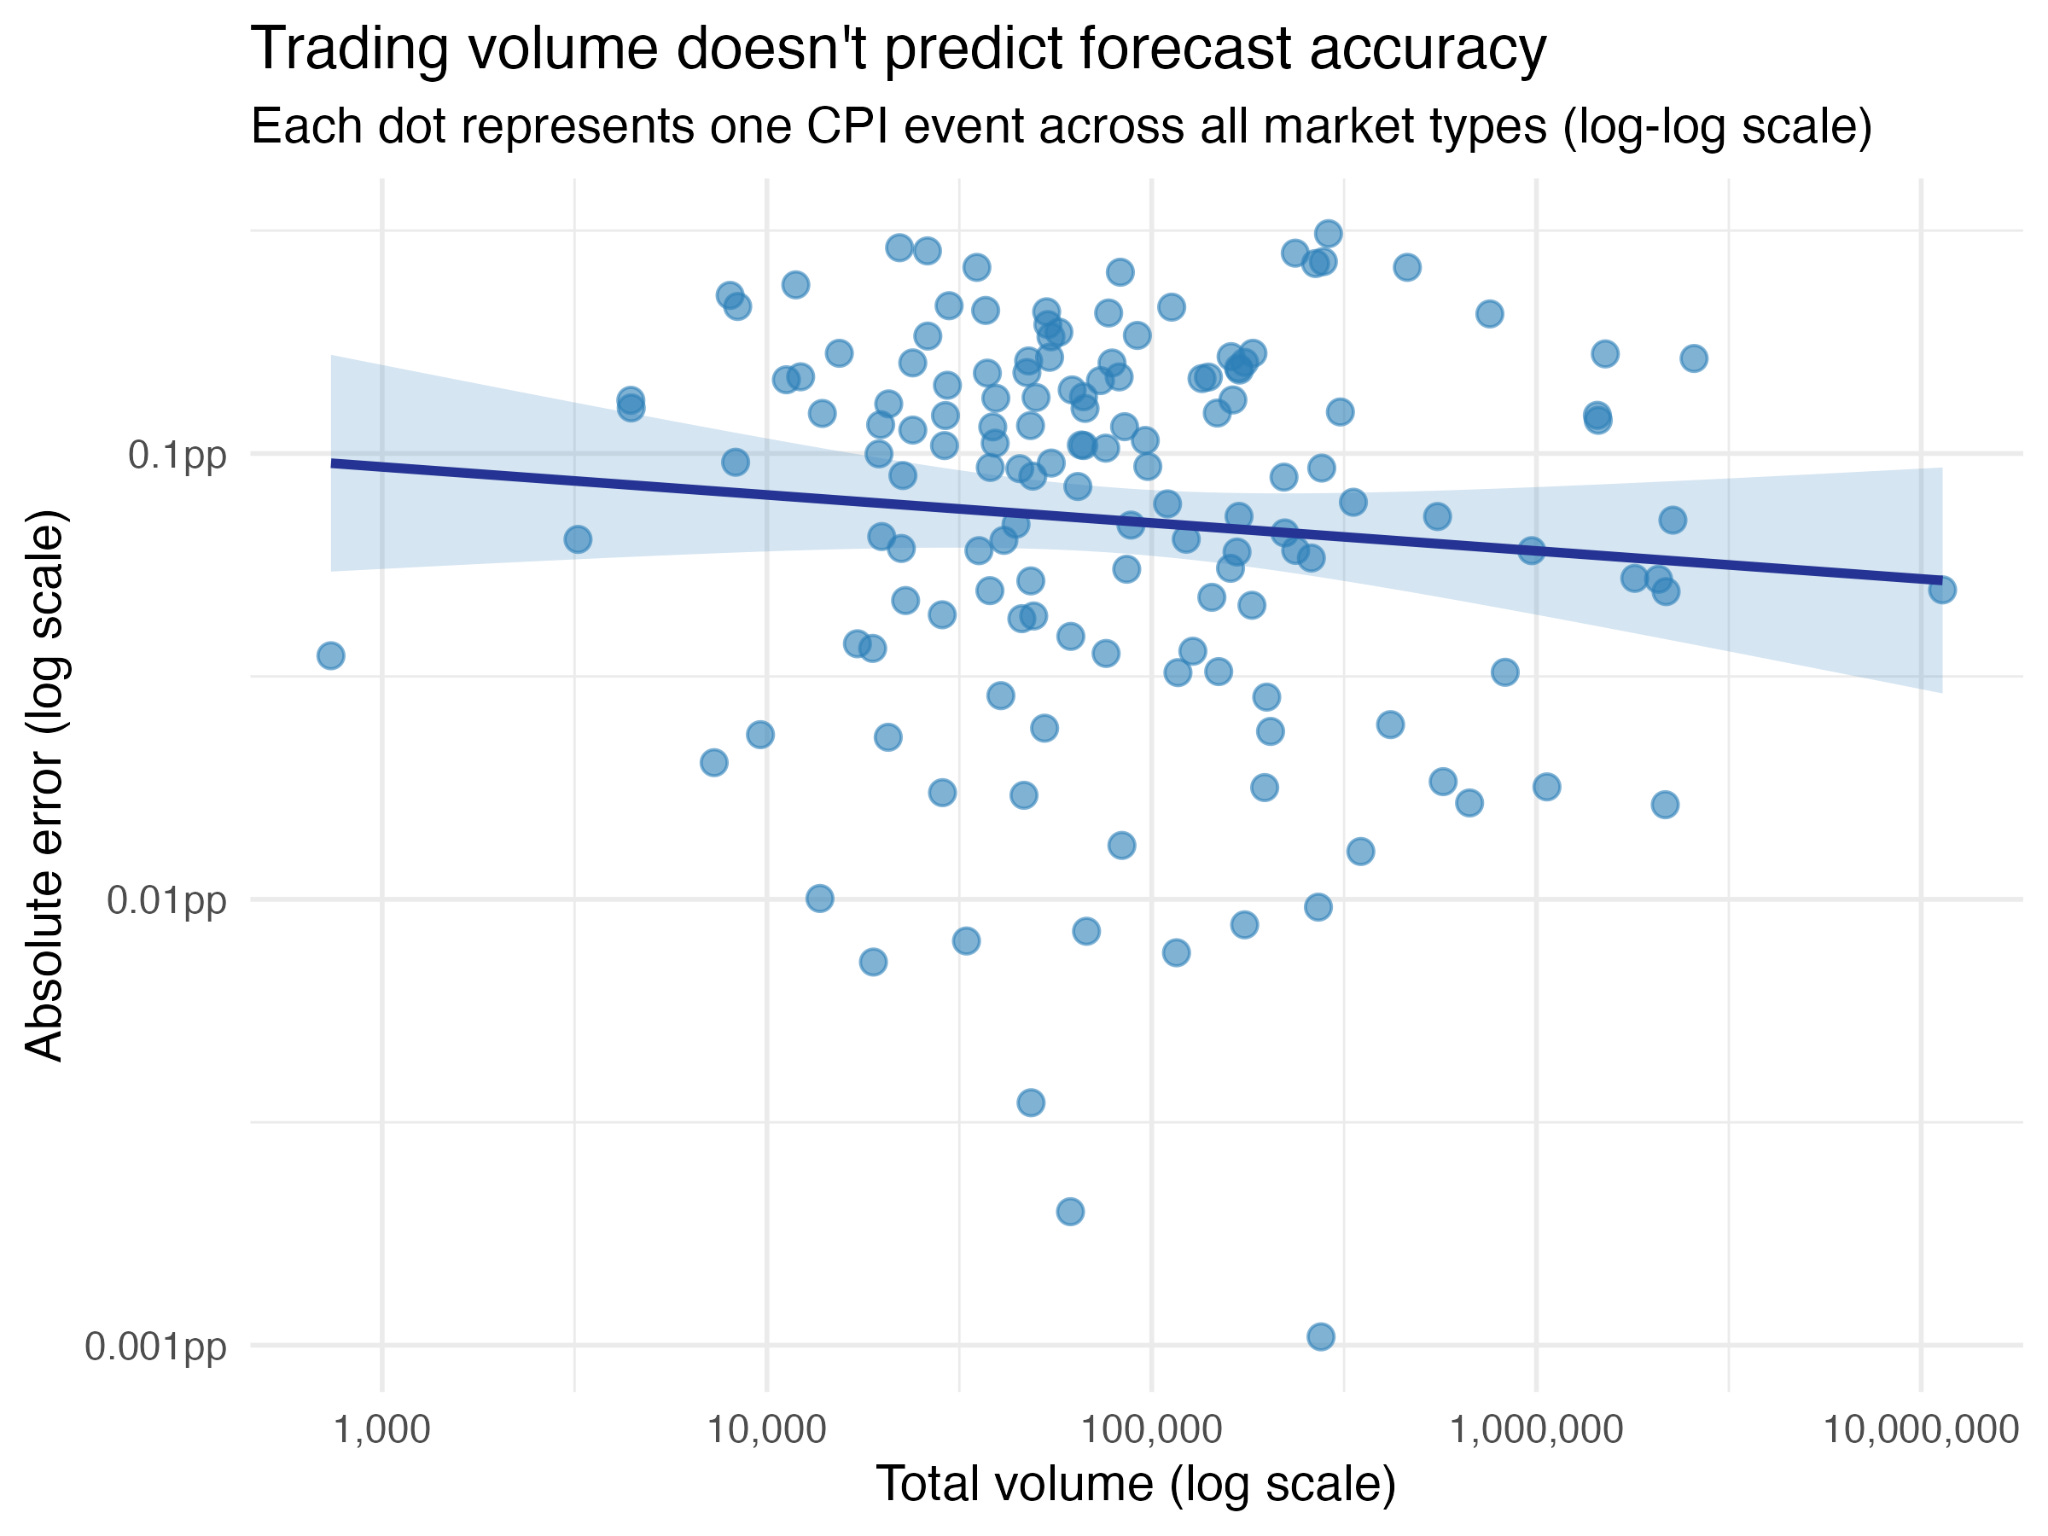
I went back and analyzed every CPI prediction market Kalshi has ever listed, from June 2021 through January 2026. Nearly 150 events. Volume ranged from 7 contracts to over 11 million—a 1.6 million-fold spread. And across that entire range, trading volume explained less than 1% of the variance in forecast accuracy.2
The market was accurate when it was quiet, accurate when it was booming, and accurate in the long trough in between. Every other market in the world gets worse when volume dries up. This one survived a collapse and then shrugged off an explosion. That is the puzzle.
More isn’t more
In every other asset class, more liquidity is better. Stocks, bonds, derivatives, currencies, crypto. If the product is the trade, you want the lowest possible friction to execute it. Deeper order books, tighter spreads, more counterparties.
Prediction markets break this rule.
The reason traces back to something I wrote about in “Actually, the Price is the Product.” The vast majority of people who engage with prediction market prices never place a trade. They check the number, they see “72% chance of a rate cut” and inform their life. The primary consumer is the observer, not the trader, and prediction markets more approximate media than a trading product.

If the product is information, the relevant question changes. Instead of “how cheaply can I trade?”, it becomes “how cheaply can this market produce an accurate price?” Liquidity, in this framing, isn’t a benefit to the consumer, it’s more like a cost of production. And like any cost, you want to minimize it.
Last year, I interviewed Lost Zemblan, who is widely regarded as the best election trader in the world, for my podcast. He had this to say about the relationship between liquidity and efficiency:
[starts at 00:18:31]
Yeah, so certainly it’s fantastic. Volume’s gone up so much and like you touched on, you know, it’s actually crazy.
No, the market has gotten less sharp as volume has come in. It’s actually really ridiculous. Right. It’s gotten much less sharp. It’s much easier to make money now than it was a few years ago.
You know, prices are much less efficient because the new volume that’s coming in isn’t like the first adopters to prediction markets are going to be decently with it. Like, how do they find out about it? They’re probably interested in this stuff, interested in politics, you know, reasonably smart. Like, they do it as a hobby.
And then the next wave of people that we’re getting now just have no idea what they’re doing, so far as I can tell. And so they just make completely horrible bets. And so it’s definitely gotten less sharp over time, which is kind of crazy. And yeah, like you say, usually you think, oh, it gets bigger, it gets less sharp. But no, it’s not true, or, sorry, usually people say it gets more sharp. No, it’s not true. It’s gotten less sharp. Yeah.
As far as what goes in the future, I mean, I assume it keeps growing. I’m not really sure how big the potential market is compared to what. It’s just. I think the potential market for something like elections is possibly very big because it affects so many people.
Everyone has an opinion. Everyone it affects, certainly even a state governor, for instance, will affect the lives of quite a lot of people who are living in that state. And they’ll be getting a lot of information about it. Naturally, they’ll be seeing ads even if they don’t want to be hearing about it on the news. So I think there’s a lot of untapped potential.
I’m not exactly sure how much of that translates to people willing to bet a lot, but yeah, certainly I’d expect it to keep growing. And then as far as the market getting sharper over time, I think it’s just difficult.
I think it’s really just quite difficult for sharps to counteract all the flow of new money coming in, partly because there’s just fewer elections than there are sporting events, for instance. So it’s harder for someone to build up a repeatable model and a repeatable process and to be confident that they’re doing it the right way. And then at least, like me and the people I work with, I think we have a very substantial moat at this point just because we’ve been doing it for so long. We have all this data, we have all this just heuristics and things I think would be quite hard to replicate going in.
So I’m cautiously optimistic about elections staying relatively easy to beat. Maybe they get harder but relatively easy to beat for a while.
The information cost function
Here’s what actually happens when a prediction market produces an accurate price. Someone with relevant knowledge sees a contract trading at the wrong level. They buy or sell it toward the correct one. Their profit comes from the gap between the market’s price and reality. That gap is the bounty the market offers to anyone willing to contribute information.
We can formalize this. The implied bounty for correcting a mispriced market is roughly:
Information Bounty = Price Gap × Liquidity
Where the
Price Gap is the distance between the current market price and the true probability, and
Liquidity is how many dollars you can trade before moving the price to the true price.
On the other side is what I’ll call the
Cost of Expertise: the minimum expected profit an informed person would need to bother showing up. Research cost, intrinsic motivation, opportunity cost, access friction, etc.
Price discovery happens when the bounty exceeds the cost of expertise. Rearrange, and you get:
Minimum Viable Liquidity = Cost of Expertise / Price Gap
MVL: The smallest amount of liquidity a market needs to produce an accurate price.
The reason I divide the Cost of Expertise by the Price Gap is because if something is super-duper mispriced, then it needs less liquidity to get someone to correct it.
Below a market’s MVL, the bounty isn’t large enough to attract anyone with real information and the price is just noise. Above the MVL, additional liquidity doesn’t improve accuracy, it actually just raises the cost the next informed trader would have to pay to correct the mis-pricing. Yes, that “cost” is the trader’s PnL, but as an observer, I don’t really care about the trader’s PnL.
How fast accuracy saturates depends on the information ecology of the question. For elections, weather, and major sports, massive communities of intrinsically motivated people already exist. Their cost of expertise is pretty cheap for most markets… a few thousand dollars of liquidity produces a world-class forecast.
For forecasting an obscure regulatory ruling, or the result of a shale oil exploration in Alberta, Canada, or anything sufficiently niche, where the information is concentrated among a handful of specialists with high opportunity costs, you may need real money to draw them in.
Even for something as big as central bank decisions, tens of thousands gets you most of the way there. But the reason you can make billions of dollars for being a better forecaster of central bank decisions than others is because there just happens to be these unbelievably deep and liquid markets in bonds and currencies that move according to those decisions.
Those markets exist to enable countries to borrow and for corporations to do international trade, and they need to be deep and liquid for the world’s economy to keep humming. In my view, it’s almost coincidental that being good at parsing fedspeak is worth billions.
The price tag for truth varies by the topic and the opportunity cost of the traders who know the true price. Prediction markets are different because the price is the product, and that product is not actually very expensive to buy. For most questions that matter to everyday life, it is shockingly cheap.
A learning curve, not a liquidity curve
Let’s return to the CPI market. The framework above explains what happened with uncomfortable precision.
In the early days, the casual traders’ losses weren’t wasted. That flow created a bounty large enough to justify the sharp traders’ upfront investment: months of work building CPI models, sourcing component data, learning the BLS methodology. The cost of expertise was high, and the fish flow covered it. They were, in effect, venture capital for forecasting infrastructure.
As the models matured and the fish left, the sharp traders had already built their pipelines. The marginal effort of producing a CPI forecast each month was maybe an hour of updating inputs, and a few hundred dollars of expected profit was plenty of incentive. The marginal cost of expertise collapsed, and MVL collapsed with it. What once required hundreds of thousands of contracts of flow now sustained itself on a few thousand.
What the market converged to was a financially incentivized peer review process: a handful of calibrated experts, each checking the others’ work, with real money keeping everyone honest. The typical forecast missed the actual CPI print by less than a tenth of a percentage point.3
And the forecasters kept getting better. Accuracy improved steadily from 2022 through 2026. Typical errors fell from 0.131 percentage points down to 0.074pp, even as volume collapsed by 95% in the middle of that period.
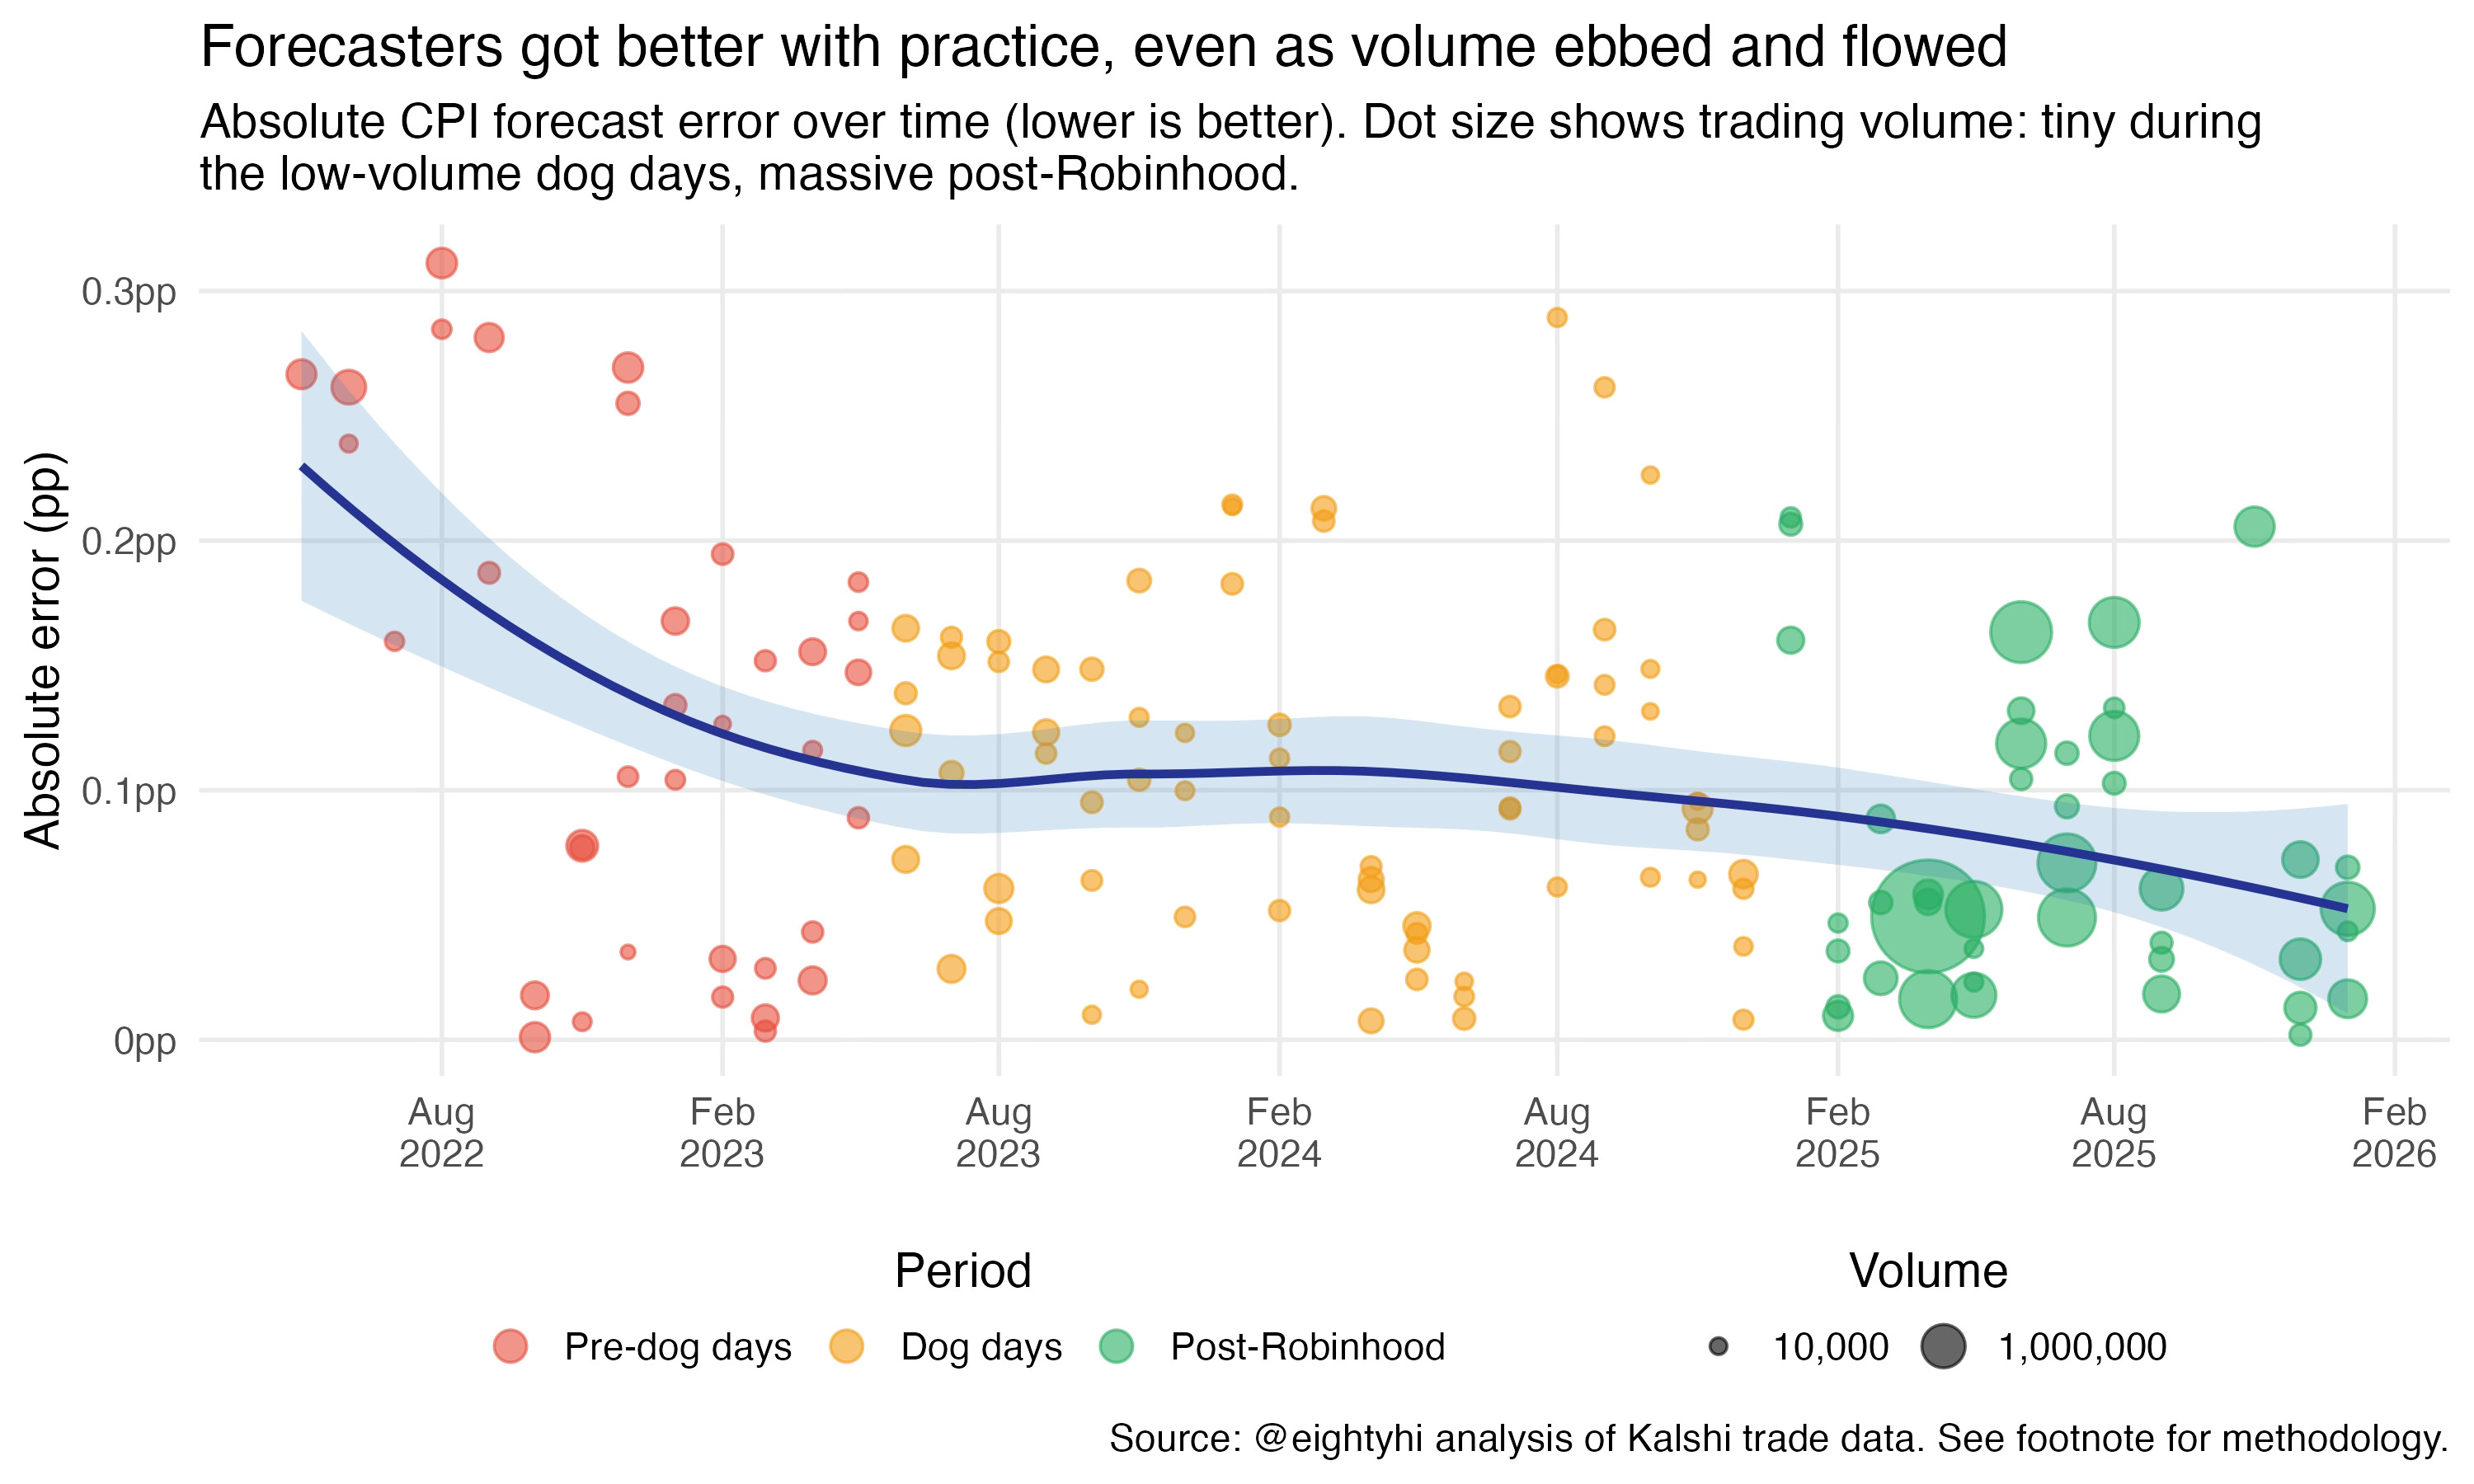
Each CPI event was practice: learning which preliminary indicators mattered, which seasonal adjustments were reliable, where the BLS methodology had edge cases. The dog days didn’t stop this learning. If anything, the handful of serious traders left standing got better per event, since they were trading against each other with no noise from casual flow.
Then Robinhood happened. Millions of new contracts, fish returning to a market that had long since stopped needing them. The accuracy kept improving, but not because of the volume itself. Look at the learning curve: the biggest dots appear right when Robinhood surfaced the markets, but the accuracy gains come from the continued downward slope, not from the size of the dots4.
The new fish flow raised the stakes. More money on the table meant sharper traders had more reason to invest in refining their models further. But that refinement took time, just like it did in the early days. The scatter plot shows volume doesn’t instantly buy you accuracy. The learning curve shows what does: time, practice, and the incentive to keep getting better.
What this means
If MVL is low, the strategic priority for the prediction market industry shifts. Breadth over depth. 100,000 thin markets covering 100,000 questions produces more social and informational value than one deep market on the presidential election or the Super Bowl. The winning platform won’t necessarily be the one with the deepest order books. It will be the one that asks the most questions.
Subsidies, where they’re needed, may only need to be temporary. The CPI story suggests that thin markets need startup capital: enough early liquidity to attract the sharp traders who will build forecasting infrastructure. Once that infrastructure exists, the market sustains itself on almost nothing. Think of it as venture capital seed funding for information production, not an ongoing operating expense.
Prediction markets are the cheapest mechanism humanity has ever built for buying information about the future. A few thousand dollars can produce a forecast that outperforms million-dollar polling operations. The CPI markets I watched evolve over three and a half years taught me this firsthand - the forscasts we produced regularly topped all of the sell-side research teams at Goldman, Barclays, and Jeffries.
MVL for prediction markets is lower than you’d think. The information doesn’t require deep liquidity. It requires the right people, the right questions, and just enough money to make it worth their while.
It requires a reframing of how we think about liquidity in this new asset class that may change the way we interact with the concept of risk altogether.
Fun sidenote, as a market maker for KT, of course I was one of the ones doing all this modeling. CPI methodology is hard to understand, and I personally had so many open threads with economists at the BLS that I was one of the couple dozen “super-users” who received the infamous BLS inflation email that got the agency into very hot water. I’m really proud of that lol.
Methodology. I analyzed every CPI prediction market listed on Kalshi from June 2021 through January 2026: 177 events spanning headline and core CPI, both month-over-month and year-over-year. Each CPI event consists of multiple binary strike contracts (e.g., “Will headline CPI MoM be ≥ 0.2%?”), whose terminal YES prices define an implied cumulative distribution function. I fit a normal distribution to each event’s price ladder via least-squares optimization, yielding an implied forecast mean and uncertainty band. Events were excluded if they had fewer than two strikes on each side of the actual print, ensuring the market had enough resolution around the realized value for the fit to be meaningful. This left 149 quality-filtered events. Fit quality was high: 95% of events had R² > 0.95 and 64% exceeded 0.99. I then regressed log(absolute forecast error) on log(total trading volume) across all 149 events. The slope was -0.063, not statistically significant (correlation: -0.09, p = 0.28, 95% CI on slope: [-0.176, 0.05], R² = 0.008). The result holds when splitting by market type: the regression line is flat within each of the four CPI categories (core MoM, core YoY, headline MoM, headline YoY), with per-type mean absolute errors clustering between 0.099 and 0.108 percentage points despite large volume differences across types. Actual CPI values were sourced from FRED series CPIAUCSL (headline) and CPILFESL (core). Volume and price data come from Kalshi’s public API.
You can see my code here. It is fully replicable and I’d encourage anyone curious about my method to copy from and build on this.
Calibration and accuracy. Across 149 quality-filtered events, the median absolute forecast error was 0.093 percentage points and the mean was 0.103pp (meaning the market’s implied CPI forecast typically landed within a tenth of a point of the actual BLS print). The markets were also well-calibrated in their uncertainty: 86% of outcomes fell within two standard deviations of the market’s implied distribution, close to the theoretical 95% for a perfectly calibrated predictor, and the mean absolute z-score was 1.08. The slight underconfidence (wider bands than necessary) is the safe direction to err. The improvement in raw accuracy over time (MAE of 0.131pp in 2022 vs. 0.074pp post-Robinhood in 2025) is confounded by declining CPI volatility: the market’s own fitted standard deviations fell from 0.17-0.19pp in 2022 to 0.07-0.09pp in 2025, reflecting that month-over-month CPI prints compressed from a range of roughly -0.2% to 1.3% down to 0.1% to 0.35%. The market correctly assessed that the forecasting problem was getting easier.
Andy Hall and Elliot Paschal, who recently built the largest dataset of political prediction markets to date, find the same thing at scale. They catalogued every political prediction market on Kalshi and Polymarket and found that 98.7% qualify as ghost towns: wide spreads, almost no one on the other side of the trade. Yet the overall calibration of these markets still clusters near the line of perfect accuracy. Hall put it plainly: “less liquid markets are not necessarily less accurate. Sometimes markets stay illiquid precisely because they’re already accurate, and there’s no incentive for new money to enter.”
This is an interesting theory. One potential area for future exploration: once you're past a given minimum liquidity threshold in a market, is the informational value *inversely* correlated with liquidity?
Here's what I mean: one potential reason Kalshi markets may be more informationally accurate than Fed funds futures is that, at sufficiently deep liquidity, people are using Fed funds futures in order to hedge, not in order to get a prediction "right."
If that's true, it's not really the case that "you only need a small amount of liquidity to be very accurate." It's actually that, at sufficiently *large* liquidity, your markets (eg Fed funds futures) become less accurate because they are big enough to be used in other ways that wouldn't make sense (for most large financial institutions) on low-liquidity markets like Kalshi.
We see a slightly different version of this on Pinnacle (long the preferred bookie of sports betting sharps). Their closing lines are sometimes NOT the most efficient/accurate, because people are using Pinnacle as one leg of an arbitrage play: https://www.football-data.co.uk/blog/wisdom_of_crowd_betting_system_closing_odds.php
I discuss pieces of this in my own post on Pinnacle from a few months ago: https://networked.substack.com/p/a-view-from-the-pinnacle
Interesting concept. For long I've thought that PMs should earn from allowing institution to sponsor liquidity awards on specific questions by taking a cut out of it vs trading fees. Example: CDC sponsoring rewards on measles markets. And based on your thesis the MVL is not that high! Makes the whole approach entirely viable, especially with breadth vs depth approach.